|
|
||
The Allen Curve (Allen Plot) - Practical Approaches |
||
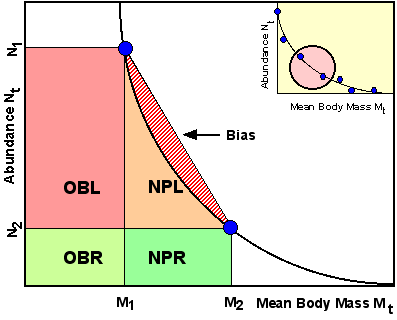
If we have a series of subsequent samples of abundance Nt and mean individual body mass Mt there is one question regarding the setup of the Allen plot calculation: how to choose the intervals for each calculation step and how to interpolate between subsequent data points. The usual straight-forward approach would be as shown in the figure below, the data points are defined as interval borders, i.e. calculation interval width equals the distance between subsequent data points and subsequent data points are connected by straight lines. The major shortcomming of this method is that the NPL triangle represents a linear approximation of the nonlinear Allen curve, i.e. we introduce a bias in our estimate of NPL which is the larger the more distant subsequent data points are. Random errors in Nt and Mt estimates may introduce further bias. |
||
 |
||
These problems may be partially overcome by - smoothing the Allen curve, either by connecting subsequent point by a smoothed line, e.g. by means of a Spline algorithm or by fitting a model (e.g. a polynome) to the Nt - Mt data. - using arbitrary interval borders, e.g. intervals of constant change in mass or abundance, and/or by using very small mass and abundance intervals. |
||
| The |
||
| for |
||
| practical applications of the Allen plot are shown by |
||
<- Allen plot page 1 <- |
||